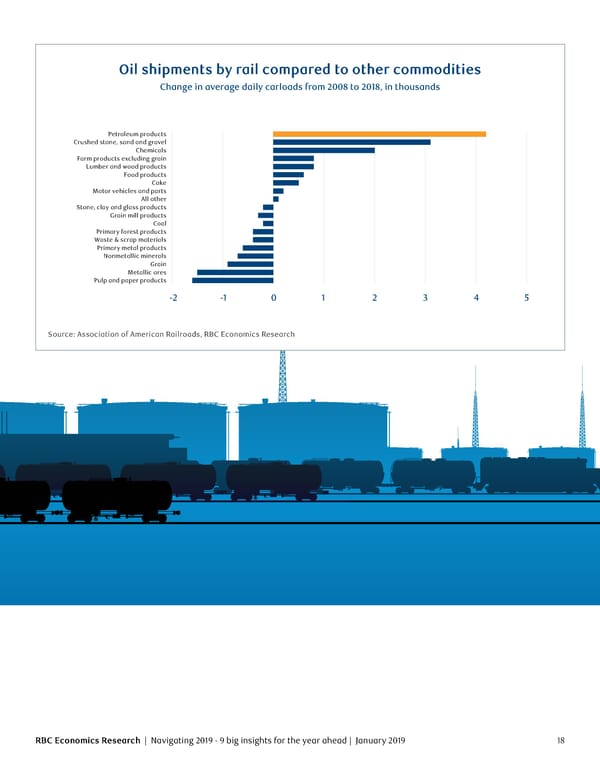
Oil shipments by rail compared to other commodities Change in average daily carloads from 2008 to 2018, in thousands Petroleum products Crushed stone, sand and gravel Chemicals arm products ecluding grain umer and ood products ood products Coke Motor vehicles and parts All other Stone, clay and glass products Grain mill products Coal Primary forest products Waste & scrap materials Primary metal products Nonmetallic minerals Grain Metallic ores Pulp and paper products -2 -1 0 1 2 3 4 5 Source: Association of American Railroads, RBC Economics Research RBC Economics Research | Navigating 2019 - 9 big insights for the year ahead | January 2019 18
 navigating 2019 Page 18 Page 20