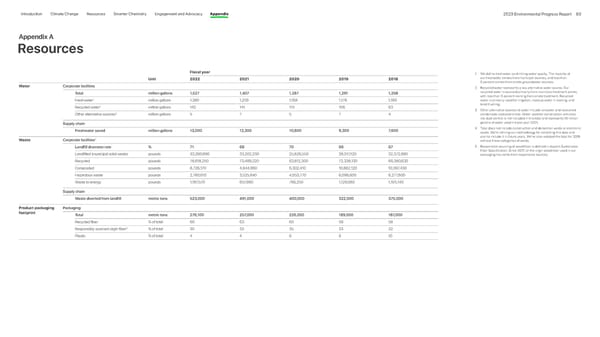
Introduction Climate Change Resources Smarter Chemistry Engagement and Advocacy Appendix 2023 Environmental Progress Report 83 Appendix A Resources Fiscal year 1 We define freshwater as drinking-water quality. The majority of Unit 2022 2021 2020 2019 2018 our freshwater comes from municipal sources, and less than 5 percent comes from onsite groundwater sources. Water Corporate facilities 2 Recycled water represents a key alternative water source. Our Total million gallons 1,527 1,407 1,287 1,291 1,258 recycled water is sourced primarily from municipal treatment plants, with less than 5 percent coming from onsite treatment. Recycled Freshwater 1 million gallons 1,380 1,259 1,168 1,178 1,190 water is primarily used for irrigation, makeup water in cooling, and Recycled water 2 million gallons 142 141 113 106 63 toilet flushing. 3 Other alternative sources of water include rainwater and recovered Other alternative sources 3 million gallons 5 7 5 7 4 condensate captured onsite. Water used for construction activities like dust control is not included in this total and represents 13 m illion Supply chain gallons of water used in fiscal year 2021. Freshwater saved million gallons 13,000 12,300 10,800 9,300 7,600 4 Total does not include construction and demolition waste or electronic waste. We’re refining our methodology for collecting this data and plan to include it in future years. We‘ve also restated the total for 2018 Waste Corporate facilities 4 without these categories of waste. Landfill diversion rate % 71 68 70 66 67 5 Responsible sourcing of wood fiber is defined in Apple’s Sustainable Landfilled (municipal solid waste) pounds 33,260,990 33,202,200 25,826,550 38,317,120 32,372,890 Fiber Specification. Since 2017, all the virgin wood fiber used in our packaging has come from responsible sources. Recycled pounds 78,618,250 73,489,220 63,812,300 72,338,130 66,380,630 Composted pounds 8,726,170 4,844,960 6,302,410 10,882,120 10,397,430 Hazardous waste pounds 2,780,610 3,525,840 4,053,770 6,096,600 6,277,800 Waste to energy pounds 1,197,570 657,890 786,250 1,129,080 1,105,140 Supply chain Waste diverted from landfill metric tons 523,000 491,000 400,000 322,000 375,000 Product packaging Packaging footprint Total metric tons 276,100 257,000 226,000 189,000 187,000 Recycled fiber % of total 66 63 60 59 58 Responsibly sourced virgin fiber 5 % of total 30 33 35 33 32 Plastic % of total 4 4 6 8 10
 Apple Environmental | Immersive Page 82 Page 84