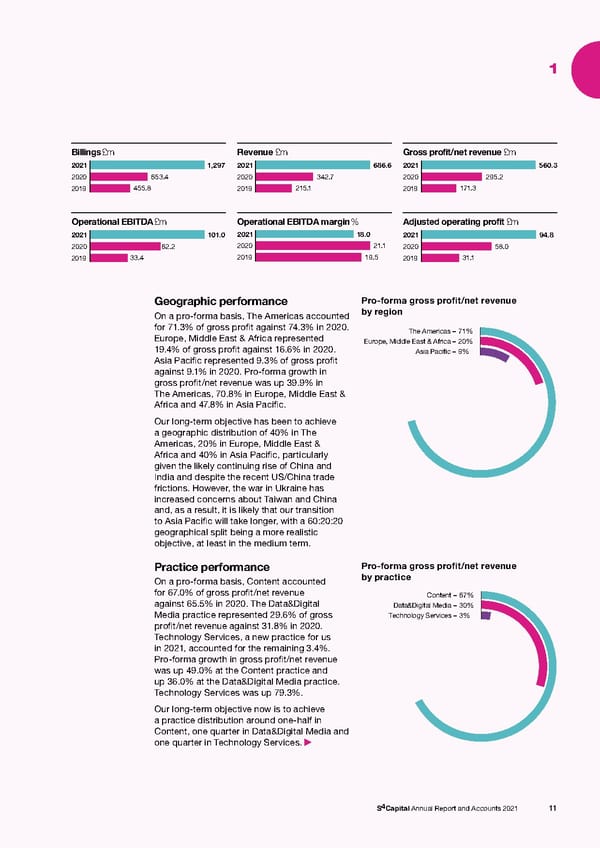
1 Billings£m Revenue £m Gross profit/net revenue £m 2021 1,297 2021 686.6 2021 560.3 2020 653.4 2020 342.7 2020 295.2 2019 455.8 2019 215.1 2019 171.3 Operational EBITDA£m Operational EBITDA margin% Adjusted operating profit £m 2021 101.0 2021 18.0 2021 94.8 2020 62.2 2020 21.1 2020 58.0 2019 33.4 2019 19.5 2019 31.1 Geographic performance Pro-forma gross profit/net revenue On a pro-forma basis, The Americas accounted by region for 71.3% of gross profit against 74.3% in 2020. The Americas – 71% Europe, Middle East & Africa represented Europe, Middle East & Africa – 20% 19.4% of gross profit against 16.6% in 2020. Asia Pacific – 9% Asia Pacific represented 9.3% of gross profit against 9.1% in 2020. Pro-forma growth in gross profit/net revenue was up 39.9% in The Americas, 70.8% in Europe, Middle East & Africa and 47.8% in Asia Pacific. Our long-term objective has been to achieve a geographic distribution of 40% in The Americas, 20% in Europe, Middle East & Africa and 40% in Asia Pacific, particularly given the likely continuing rise of China and India and despite the recent US/China trade frictions. However, the war in Ukraine has increased concerns about Taiwan and China and, as a result, it is likely that our transition to Asia Pacific will take longer, with a 60:20:20 geographical split being a more realistic objective, at least in the medium term. Practice performance Pro-forma gross profit/net revenue On a pro-forma basis, Content accounted by practice for 67.0% of gross profit/net revenue Content – 67% against 65.5% in 2020. The Data&Digital Data&Digital Media – 30% Media practice represented 29.6% of gross Technology Services – 3% profit/net revenue against 31.8% in 2020. Technology Services, a new practice for us in 2021, accounted for the remaining 3.4%. Pro-forma growth in gross profit/net revenue was up 49.0% at the Content practice and up 36.0% at the Data&Digital Media practice. Technology Services was up 79.3%. Our long-term objective now is to achieve a practice distribution around one-half in Content, one quarter in Data&Digital Media and one quarter in Technology Services. S4Capital Annual Report and Accounts 2021 11
 s4 capital annual report and accounts 2021 Page 12 Page 14