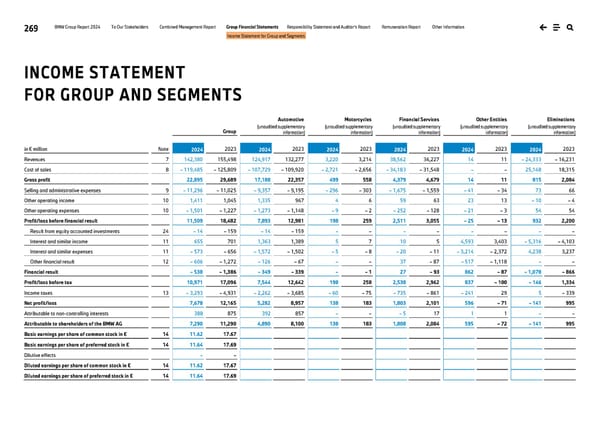
269 BMW Group Report 2024 To Our Stakeholders Combined Management Report Group Financial Statements Responsibility Statement and Auditor’s Report Remuneration Report Other Information Income Statement for Group and Segments Group Automotive Motorcycles Financial Services Other Entities Eliminations (unaudited supplementary information) (unaudited supplementary information) (unaudited supplementary information) (unaudited supplementary information) (unaudited supplementary information) in € million Note 2024 2023 2024 2023 2024 2023 2024 2023 2024 2023 2024 2023 Revenues 7 142,380 155,498 124,917 132,277 3,220 3,214 38,562 36,227 14 11 – 24,333 – 16,231 Cost of sales 8 – 119,485 – 125,809 – 107,729 – 109,920 – 2,721 – 2,656 – 34,183 – 31,548 – – 25,148 18,315 Gross profit 22,895 29,689 17,188 22,357 499 558 4,379 4,679 14 11 815 2,084 Selling and administrative expenses 9 – 11,296 – 11,025 – 9,357 – 9,195 – 296 – 303 – 1,675 – 1,559 – 41 – 34 73 66 Other operating income 10 1,411 1,045 1,335 967 4 6 59 63 23 13 – 10 – 4 Other operating expenses 10 – 1,501 – 1,227 – 1,273 – 1,148 – 9 – 2 – 252 – 128 – 21 – 3 54 54 Profit/loss before financial result 11,509 18,482 7,893 12,981 198 259 2,511 3,055 – 25 – 13 932 2,200 Result from equity accounted investments 24 – 14 – 159 – 14 – 159 – – – – – – – – Interest and similar income 11 655 701 1,363 1,389 5 7 10 5 4,593 3,403 – 5,316 – 4,103 Interest and similar expenses 11 – 573 – 656 – 1,572 – 1,502 – 5 – 8 – 20 – 11 – 3,214 – 2,372 4,238 3,237 Other financial result 12 – 606 – 1,272 – 126 – 67 – – 37 – 87 – 517 – 1,118 – – Financial result – 538 – 1,386 – 349 – 339 – – 1 27 – 93 862 – 87 – 1,078 – 866 Profit/loss before tax 10,971 17,096 7,544 12,642 198 258 2,538 2,962 837 – 100 – 146 1,334 Income taxes 13 – 3,293 – 4,931 – 2,262 – 3,685 – 60 – 75 – 735 – 861 – 241 29 5 – 339 Net profit/loss 7,678 12,165 5,282 8,957 138 183 1,803 2,101 596 – 71 – 141 995 Attributable to non-controlling interests 388 875 392 857 – – – 5 17 1 1 – – Attributable to shareholders of the BMW AG 7,290 11,290 4,890 8,100 138 183 1,808 2,084 595 – 72 – 141 995 Basic earnings per share of common stock in € 14 11.62 17.67 Basic earnings per share of preferred stock in € 14 11.64 17.69 Dilutive effects – – Diluted earnings per share of common stock in € 14 11.62 17.67 Diluted earnings per share of preferred stock in € 14 11.64 17.69 INCOME STATEMENT FOR GROUP AND SEGMENTS
 BMW Group Report 2024 Page 268 Page 270