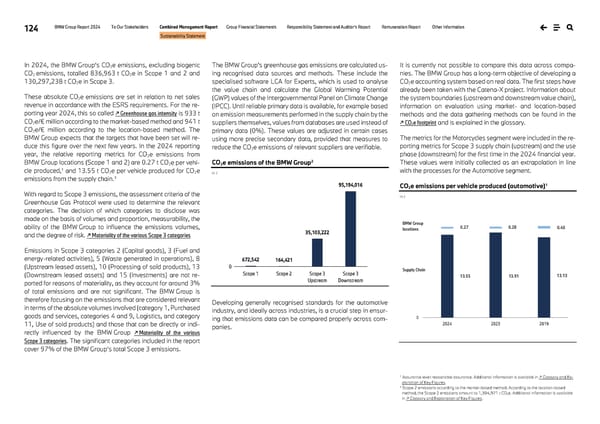
124 BMW Group Report 2024 To Our Stakeholders Combined Management Report Group Financial Statements Responsibility Statement and Auditor’s Report Remuneration Report Other Information Sustainability Statement In 2024, the BMW Group’s CO2e emissions, excluding biogenic CO2 emissions, totalled 836,963 t CO2e in Scope 1 and 2 and 130,297,238 t CO2e in Scope 3. These absolute CO2e emissions are set in relation to net sales revenue in accordance with the ESRS requirements. For the re- porting year 2024, this so called ↗ Greenhouse gas intensity is 933 t CO2e/€ million according to the market-based method and 941 t CO2e/€ million according to the location-based method. The BMW Group expects that the targets that have been set will re- duce this figure over the next few years. In the 2024 reporting year, the relative reporting metrics for CO2e emissions from BMW Group locations (Scope 1 and 2) are 0.27 t CO2e per vehi- cle produced,1 and 13.55 t CO2e per vehicle produced for CO2e emissions from the supply chain.1 With regard to Scope 3 emissions, the assessment criteria of the Greenhouse Gas Protocol were used to determine the relevant categories. The decision of which categories to disclose was made on the basis of volumes and proportion, measurability, the ability of the BMW Group to influence the emissions volumes, and the degree of risk. ↗ Materiality of the various Scope 3 categories Emissions in Scope 3 categories 2 (Capital goods), 3 (Fuel and energy-related activities), 5 (Waste generated in operations), 8 (Upstream leased assets), 10 (Processing of sold products), 13 (Downstream leased assets) and 15 (Investments) are not re- ported for reasons of materiality, as they account for around 3% of total emissions and are not significant. The BMW Group is therefore focusing on the emissions that are considered relevant in terms of the absolute volumes involved (category 1, Purchased goods and services, categories 4 and 9, Logistics, and category 11, Use of sold products) and those that can be directly or indi- rectly influenced by the BMW Group ↗ Materiality of the various Scope 3 categories. The significant categories included in the report cover 97% of the BMW Group’s total Scope 3 emissions. The BMW Group's greenhouse gas emissions are calculated us- ing recognised data sources and methods. These include the specialised software LCA for Experts, which is used to analyse the value chain and calculate the Global Warming Potential (GWP) values of the Intergovernmental Panel on Climate Change (IPCC). Until reliable primary data is available, for example based on emission measurements performed in the supply chain by the suppliers themselves, values from databases are used instead of primary data (0%). These values are adjusted in certain cases using more precise secondary data, provided that measures to reduce the CO2e emissions of relevant suppliers are verifiable. CO2e emissions of the BMW Group2 in t Developing generally recognised standards for the automotive industry, and ideally across industries, is a crucial step in ensur- ing that emissions data can be compared properly across com- panies. It is currently not possible to compare this data across compa- nies. The BMW Group has a long-term objective of developing a CO2e accounting system based on real data. The first steps have already been taken with the Catena-X project. Information about the system boundaries (upstream and downstream value chain), information on evaluation using market- and location-based methods and the data gathering methods can be found in the ↗ CO2e footprint and is explained in the glossary. The metrics for the Motorcycles segment were included in the re- porting metrics for Scope 3 supply chain (upstream) and the use phase (downstream) for the first time in the 2024 financial year. These values were initially collected as an extrapolation in line with the processes for the Automotive segment. CO2e emissions per vehicle produced (automotive)1 in t 1 Assurance level: reasonable assurance. Additional information is available in ↗ Glossary and Ex- planation of Key Figures. 2 Scope 2 emissions according to the market-based method. According to the location-based method, the Scope 2 emissions amount to 1,304,971 t CO2e. Additional information is available in ↗ Glossary and Explanation of Key Figures. 672,542 164,421 35,103,222 95,194,016 Scope 1 Scope 2 Scope 3 Upstream Scope 3 Downstream 0 13.55 13.91 13.13 0.27 0.28 0.40 0 2024 2023 2019 BMW Group locations Supply Chain
 BMW Group Report 2024 Page 123 Page 125