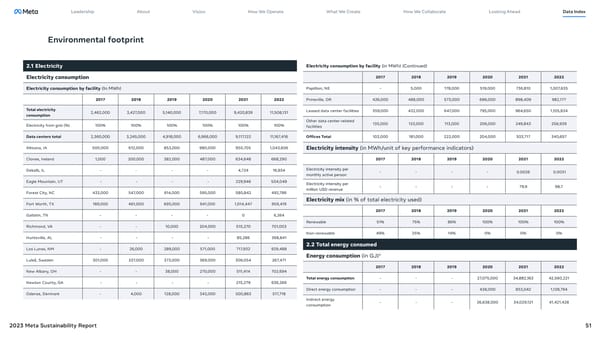
Leadership About Vision How We Operate What We Create How We Collaborate Looking Ahead Data Index Environmental footprint 2.1 Electricity Electricity consumption by facility (in MWh) (Continued) Electricity consumption 2017 2018 2019 2020 2021 2022 Electricity consumption by facility (In MWh) Papillion, NE - 5,000 178,000 519,000 736,810 1,007,635 2017 2018 2019 2020 2021 2022 Prineville, OR 426,000 488,000 573,000 686,000 898,409 982,177 Total electricity 2,462,000 3,427,000 5,140,000 7,170,000 9,420,839 11,508,131 Leased data center facilities 359,000 432,000 647,000 795,000 964,650 1,105,834 consumption Other data center-related 135,000 133,000 113,000 206,000 249,843 256,939 Electricity from grid (%) 100% 100% 100% 100% 100% 100% facilities Data centers total 2,360,000 3,245,000 4,918,000 6,966,000 9,117,122 11,167,416 Offices Total 102,000 181,000 222,000 204,000 303,717 340,657 Altoona, IA 500,000 612,000 853,000 980,000 950,705 1,043,606 Electricity intensity (in MWh/unit of key performance indicators) Clonee, Ireland 1,000 200,000 382,000 487,000 634,648 668,290 2017 2018 2019 2020 2021 2022 Dekalb, IL - - - - 4,724 16,934 Electricity intensity per - - - - 0.0026 0.0031 monthly active person Eagle Mountain, UT - - - - 229,946 504,049 Electricity intensity per million USD revenue - - - - 79.9 98.7 Forest City, NC 433,000 547,000 614,000 595,000 580,842 492,786 Electricity mix (in % of total electricity used) Fort Worth, TX 189,000 461,000 695,000 941,000 1,014,447 959,419 2017 2018 2019 2020 2021 2022 Gallatin, TN - - - - 0 6,264 Renewable 51% 75% 86% 100% 100% 100% Richmond, VA - - 10,000 204,000 515,270 701,003 Non-renewable 49% 25% 14% 0% 0% 0% Huntsville, AL - - - - 85,286 368,841 2.2 Total energy consumed Los Lunas, NM - 26,000 289,000 571,000 717,932 929,488 Energy consumption (in GJ)5 Luleå, Sweden 301,000 337,000 373,000 369,000 306,054 267,471 2017 2018 2019 2020 2021 2022 New Albany, OH - - 38,000 270,000 511,414 702,694 Total energy consumption - - - 27,075,000 34,882,163 42,560,221 Newton County, GA - - - - 215,279 636,266 Direct energy consumption - - - 438,000 853,042 1,138,794 Odense, Denmark - 4,000 128,000 343,000 500,863 517,718 Indirect energy - - - 26,638,000 34,029,121 41,421,428 consumption 2023 Meta Sustainability Report 51
 Meta 2023 Sustainability Report Page 50 Page 52