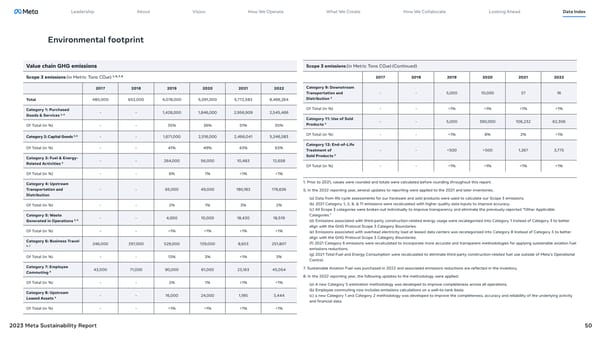
Leadership About Vision How We Operate What We Create How We Collaborate Looking Ahead Data Index Environmental footprint Value chain GHG emissions Scope 3 emissions (in Metric Tons CO2e) (Continued) Scope 3 emissions (in Metric Tons CO2e) 1, 5, 7, 8 2017 2018 2019 2020 2021 2022 2017 2018 2019 2020 2021 2022 Category 9: Downstream Transportation and - - 5,000 10,000 37 16 Total 480,000 652,000 4,078,000 5,091,000 5,772,583 8,466,264 Distribution 5 Category 1: Purchased Of Total (in %) - -
 Meta 2023 Sustainability Report Page 49 Page 51