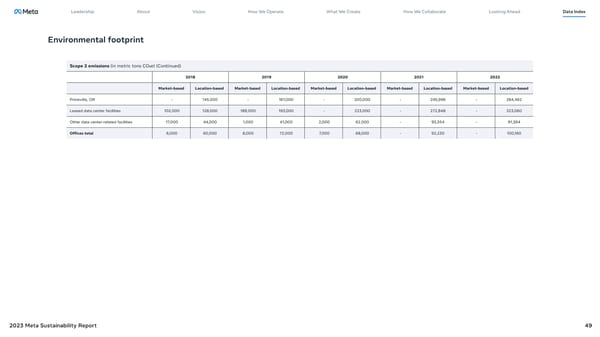
Leadership About Vision How We Operate What We Create How We Collaborate Looking Ahead Data Index Environmental footprint Scope 2 emissions (in metric tons CO2e) (Continued) 2018 2019 2020 2021 2022 Market-based Location-based Market-based Location-based Market-based Location-based Market-based Location-based Market-based Location-based Prineville, OR - 145,000 - 167,000 - 200,000 - 245,996 - 284,462 Leased data center facilities 102,000 128,000 188,000 193,000 - 223,000 - 272,848 - 323,060 Other data center-related facilities 17,000 44,000 1,000 41,000 2,000 62,000 - 93,354 - 91,364 Offices total 6,000 60,000 8,000 72,000 7,000 68,000 - 92,230 - 100,160 2023 Meta Sustainability Report 49
 Meta 2023 Sustainability Report Page 48 Page 50