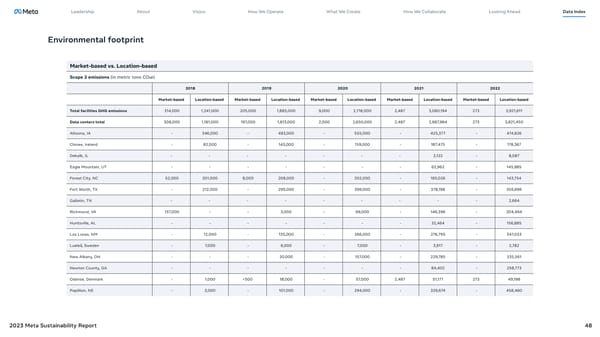
Leadership About Vision How We Operate What We Create How We Collaborate Looking Ahead Data Index Environmental footprint Market-based vs. Location-based Scope 2 emissions (in metric tons CO2e) 2018 2019 2020 2021 2022 Market-based Location-based Market-based Location-based Market-based Location-based Market-based Location-based Market-based Location-based Total facilities GHG emissions 314,000 1,241,000 205,000 1,885,000 9,000 2,718,000 2,487 3,080,194 273 3,921,611 Data centers total 308,000 1,181,000 197,000 1,813,000 2,000 2,650,000 2,487 2,987,964 273 3,821,450 Altoona, IA - 346,000 - 483,000 - 555,000 - 425,377 - 474,826 Clonee, Ireland - 82,000 - 143,000 - 159,000 - 187,475 - 178,367 Dekalb, IL - - - - - - - 2,122 - 8,087 Eagle Mountain, UT - - - - - - - 62,962 - 145,985 Forest City, NC 52,000 201,000 8,000 208,000 - 202,000 - 165,026 - 143,754 Fort Worth, TX - 212,000 - 295,000 - 399,000 - 378,198 - 355,696 Gallatin, TN - - - - - - - - - 2,664 Richmond, VA 137,000 - - 3,000 - 69,000 - 146,396 - 204,494 Huntsville, AL - - - - - - - 32,464 - 156,885 Los Lunas, NM - 12,000 - 135,000 - 266,000 - 276,795 - 347,033 Lueleå, Sweden - 7,000 - 6,000 - 7,000 - 3,917 - 2,782 New Albany, OH - - - 20,000 - 157,000 - 229,785 - 335,561 Newton County, GA - - - - - - - 84,402 - 258,773 Odense, Denmark - 1,000
 Meta 2023 Sustainability Report Page 47 Page 49