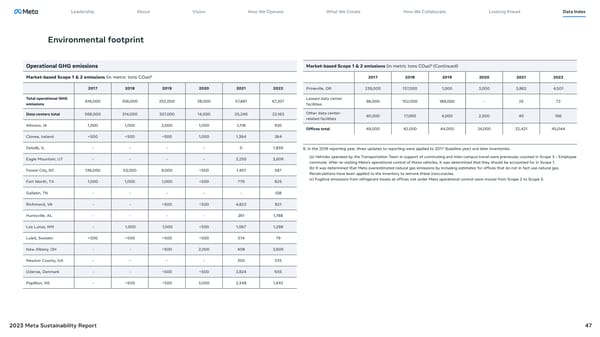
Leadership About Vision How We Operate What We Create How We Collaborate Looking Ahead Data Index Environmental footprint Operational GHG emissions Market-based Scope 1 & 2 emissions (in metric tons CO2e)6 (Continued) Market-based Scope 1 & 2 emissions (in metric tons CO2e)6 2017 2018 2019 2020 2021 2022 2017 2018 2019 2020 2021 2022 Prineville, OR 239,000 137,000 1,000 3,000 3,862 4,501 Total operational GHG 616,000 356,000 252,000 38,000 57,661 67,207 Leased data center 98,000 102,000 188,000 - 25 72 emissions facilities Data centers total 568,000 314,000 207,000 14,000 25,240 22,163 Other data center- 40,000 17,000 4,000 2,000 40 166 related facilities Altoona, IA 1,000 1,000 2,000 1,000 2,118 920 Offices total 48,000 42,000 44,000 24,000 32,421 45,044 Clonee, Ireland
 Meta 2023 Sustainability Report Page 46 Page 48