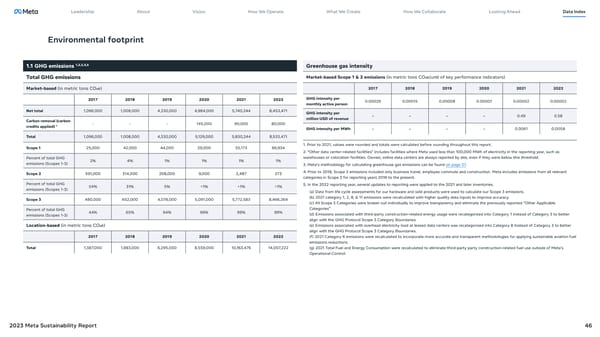
Leadership About Vision How We Operate What We Create How We Collaborate Looking Ahead Data Index Environmental footprint 1.1 GHG emissions 1,2,3,4,5 Greenhouse gas intensity Total GHG emissions Market-based Scope 1 & 2 emissions (in metric tons CO2e/unit of key performance indicators) Market-based (in metric tons CO2e) 2017 2018 2019 2020 2021 2022 2017 2018 2019 2020 2021 2022 GHG intensity per 0.00029 0.00015 0.00008 0.00001 0.00002 0.00002 monthly active person Net total 1,096,000 1,008,000 4,330,000 4,984,000 5,740,244 8,453,471 GHG intensity per million USD of revenue - - - - 0.49 0.58 Carbon removal (carbon - - - 145,000 90,000 80,000 credits applied) 7 GHG intensity per MWh - - - - 0.0061 0.0058 Total 1,096,000 1,008,000 4,330,000 5,129,000 5,830,244 8,533,471 Scope 1 25,000 42,000 44,000 29,000 55,173 66,934 1. Prior to 2021, values were rounded and totals were calculated before rounding throughout this report. 2. “Other data center-related facilities” includes facilities where Meta used less than 100,000 MWh of electricity in the reporting year, such as Percent of total GHG 2% 4% 1% 1% 1% 1% warehouses or colocation facilities. Owned, online data centers are always reported by site, even if they were below this threshold. emissions (Scopes 1-3) 3. Meta’s methodology for calculating greenhouse gas emissions can be found on page 57. Scope 2 591,000 314,000 208,000 9,000 2,487 273 4. Prior to 2018, Scope 3 emissions included only business travel, employee commute and construction. Meta includes emissions from all relevant categories in Scope 3 for reporting years 2019 to the present. Percent of total GHG 54% 31% 5%
 Meta 2023 Sustainability Report Page 45 Page 47