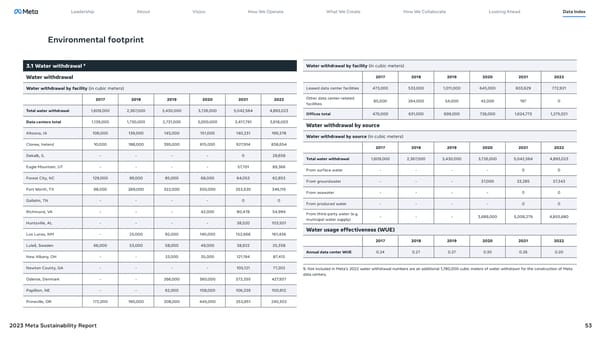
Leadership About Vision How We Operate What We Create How We Collaborate Looking Ahead Data Index Environmental footprint 3.1 Water withdrawal 9 Water withdrawal by facility (in cubic meters) Water withdrawal 2017 2018 2019 2020 2021 2022 Water withdrawal by facility (in cubic meters) Leased data center facilities 473,000 533,000 1,011,000 645,000 603,629 772,921 2017 2018 2019 2020 2021 2022 Other data center-related 85,000 264,000 54,000 42,000 197 0 facilities Total water withdrawal 1,609,000 2,367,000 3,430,000 3,726,000 5,042,564 4,893,023 Offices total 470,000 631,000 699,000 726,000 1,624,773 1,275,021 Data centers total 1,139,000 1,730,000 2,731,000 3,000,000 3,417,791 3,618,003 Water withdrawal by source Altoona, IA 106,000 139,000 145,000 151,000 140,231 199,378 Water withdrawal by source (in cubic meters) Clonee, Ireland 10,000 188,000 395,000 615,000 927,914 838,654 2017 2018 2019 2020 2021 2022 Dekalb, IL - - - - 0 29,659 Total water withdrawal 1,609,000 2,367,000 3,430,000 3,726,000 5,042,564 4,893,023 Eagle Mountain, UT - - - - 57,701 89,366 From surface water - - - - 0 0 Forest City, NC 129,000 99,000 85,000 68,000 64,053 62,853 From groundwater - - - 37,000 33,285 37,343 Fort Worth, TX 98,000 269,000 322,000 300,000 253,520 346,115 From seawater - - - - 0 0 Gallatin, TN - - - - 0 0 From produced water - - - - 0 0 Richmond, VA - - - 42,000 80,478 54,994 From third-party water (e.g. municipal water supply) - - - 3,689,000 5,009,279 4,855,680 Huntsville, AL - - - - 38,520 103,501 Water usage effectiveness (WUE) Los Lunas, NM - 25,000 92,000 140,000 152,666 161,436 2017 2018 2019 2020 2021 2022 Luleå, Sweden 66,000 53,000 58,000 49,000 38,922 25,358 Annual data center WUE 0.24 0.27 0.27 0.30 0.26 0.20 New Albany, OH - - 33,000 35,000 121,194 87,413 Newton County, GA - - - - 105,121 77,203 9. Not included in Meta’s 2022 water withdrawal numbers are an additional 1,780,000 cubic meters of water withdrawn for the construction of Meta data centers. Odense, Denmark - - 266,000 360,000 373,355 427,937 Papillion, NE - - 62,000 108,000 106,339 100,912 Prineville, OR 172,000 160,000 208,000 445,000 353,951 240,302 2023 Meta Sustainability Report 53
 Meta 2023 Sustainability Report Page 52 Page 54