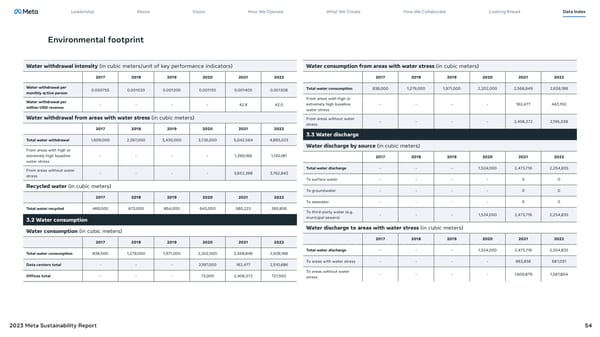
Leadership About Vision How We Operate What We Create How We Collaborate Looking Ahead Data Index Environmental footprint Water withdrawal intensity (in cubic meters/unit of key performance indicators) Water consumption from areas with water stress (in cubic meters) 2017 2018 2019 2020 2021 2022 2017 2018 2019 2020 2021 2022 Water withdrawal per 0.000755 0.001020 0.001200 0.001130 0.001405 0.001308 Total water consumption 838,000 1,279,000 1,971,000 2,202,000 2,568,849 2,638,188 monthly active person Water withdrawal per From areas with high or million USD revenue - - - - 42.8 42.0 extremely high baseline - - - - 162,477 443,150 water stress Water withdrawal from areas with water stress (in cubic meters) From areas without water - - - - 2,406,372 2,195,038 stress 2017 2018 2019 2020 2021 2022 3.3 Water discharge Total water withdrawal 1,609,000 2,367,000 3,430,000 3,726,000 5,042,564 4,893,023 Water discharge by source (in cubic meters) From areas with high or extremely high baseline - - - - 1,390,166 1,130,181 2017 2018 2019 2020 2021 2022 water stress From areas without water Total water discharge - - - 1,524,000 2,473,716 2,254,835 stress - - - - 3,652,398 3,762,843 To surface water - - - - 0 0 Recycled water (in cubic meters) To groundwater - - - - 0 0 2017 2018 2019 2020 2021 2022 To seawater - - - - 0 0 Total water recycled 469,000 673,000 854,000 643,000 580,223 265,906 To third-party water (e.g. municipal sewers) - - - 1,524,000 2,473,716 2,254,835 3.2 Water consumption Water consumption (in cubic meters) Water discharge to areas with water stress (in cubic meters) 2017 2018 2019 2020 2021 2022 2017 2018 2019 2020 2021 2022 Total water consumption 838,000 1,279,000 1,971,000 2,202,000 2,568,849 2,638,188 Total water discharge - - - 1,524,000 2,473,716 2,254,835 Data centers total - - - 2,197,000 162,477 2,510,686 To areas with water stress - - - - 863,836 687,031 To areas without water - - - - 1,609,879 1,567,804 Offices total - - - 73,000 2,406,372 127,502 stress 2023 Meta Sustainability Report 54
 Meta 2023 Sustainability Report Page 53 Page 55