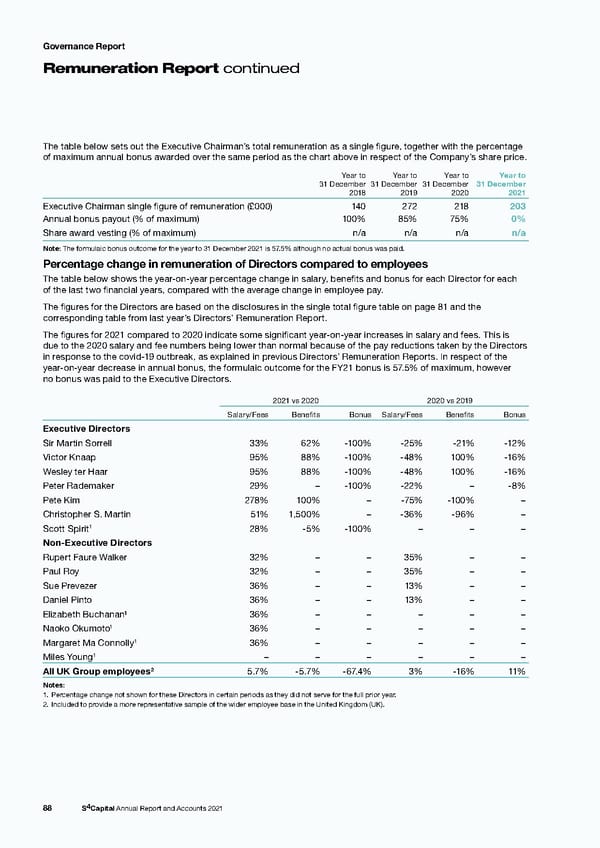
Governance Report Remuneration Report continued The table below sets out the Executive Chairman’s total remuneration as a single figure, together with the percentage of maximum annual bonus awarded over the same period as the chart above in respect of the Company’s share price. Year to Year to Year to Year to 31 December 31 December 31 December 31 December 2018 2019 2020 2021 Executive Chairman single figure of remuneration (£000) 140 272 218 203 Annual bonus payout (% of maximum) 100% 85% 75% 0% Share award vesting (% of maximum) n/a n/a n/a n/a Note: The formulaic bonus outcome for the year to 31 December 2021 is 57.5% although no actual bonus was paid. Percentage change in remuneration of Directors compared to employees The table below shows the year-on-year percentage change in salary, benefits and bonus for each Director for each of the last two financial years, compared with the average change in employee pay. The figures for the Directors are based on the disclosures in the single total figure table on page 81 and the corresponding table from last year’s Directors’ Remuneration Report. The figures for 2021 compared to 2020 indicate some significant year-on-year increases in salary and fees. This is due to the 2020 salary and fee numbers being lower than normal because of the pay reductions taken by the Directors in response to the covid-19 outbreak, as explained in previous Directors’ Remuneration Reports. In respect of the year-on-year decrease in annual bonus, the formulaic outcome for the FY21 bonus is 57.5% of maximum, however no bonus was paid to the Executive Directors. 2021 vs 2020 2020 vs 2019 Salary/Fees Benefits Bonus Salary/Fees Benefits Bonus Executive Directors Sir Martin Sorrell 33% 62% -100% -25% -21% -12% Victor Knaap 95% 88% -100% -48% 100% -16% Wesley ter Haar 95% 88% -100% -48% 100% -16% Peter Rademaker 29% – -100% -22% – -8% Pete Kim 278% 100% – -75% -100% – Christopher S. Martin 51% 1,500% – -36% -96% – 1 28% -5% -100% – – – Scott Spirit Non-Executive Directors Rupert Faure Walker 32% – – 35% – – Paul Roy 32% – – 35% – – Sue Prevezer 36% – – 13% – – Daniel Pinto 36% – – 13% – – Elizabeth Buchanan¹ 36% – – – – – 1 36% – – – – – Naoko Okumoto 1 Margaret Ma Connolly 36% – – – – – 1 – – – – – – Miles Young All UK Group employees2 5.7% -5.7% -67.4% 3% -16% 11% Notes: 1. Percentage change not shown for these Directors in certain periods as they did not serve for the full prior year. 2. Included to provide a more representative sample of the wider employee base in the United Kingdom (UK). 88 S4Capital Annual Report and Accounts 2021
 s4 capital annual report and accounts 2021 Page 89 Page 91