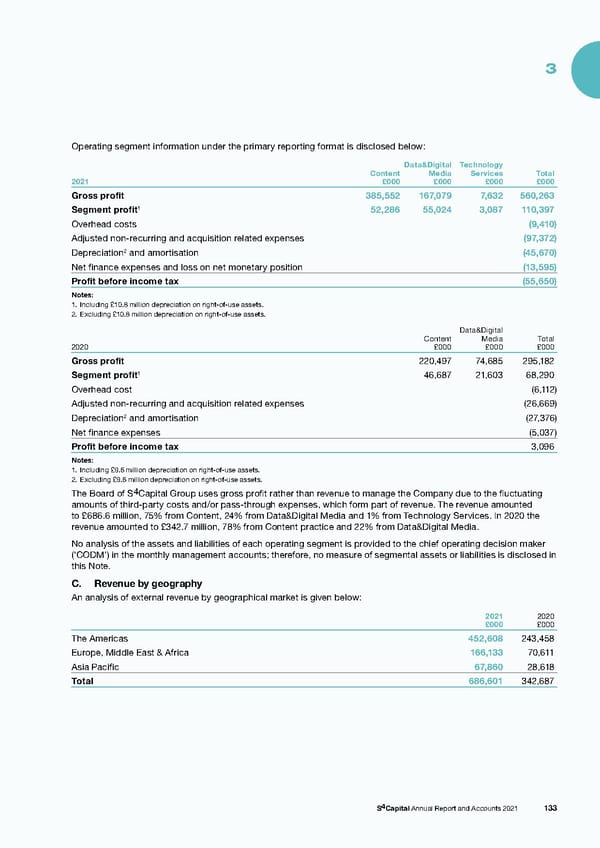
3 Operating segment information under the primary reporting format is disclosed below: Data&Digital Technology Content Media Services Total 2021 £000 £000 £000 £000 Gross profit 385,552 167,079 7,632 560,263 1 52,286 55,024 3,087 110,397 Segment profit Overhead costs (9,410) Adjusted non-recurring and acquisition related expenses (97,372) 2 and amortisation (45,670) Depreciation Net finance expenses and loss on net monetary position (13,595) Profit before income tax (55,650) Notes: 1. Including £10.8 million depreciation on right-of-use assets. 2. Excluding £10.8 million depreciation on right-of-use assets. Data&Digital Content Media Total 2020 £000 £000 £000 Gross profit 220,497 74,685 295,182 1 Segment profit 46,687 21,603 68,290 Overhead cost ( 6,112) Adjusted non-recurring and acquisition related expenses (26,669) 2 and amortisation ( 27,376) Depreciation Net finance expenses (5,037) Profit before income tax 3,096 Notes: 1. Including £9.6 million depreciation on right-of-use assets. 2. Excluding £9.6 million depreciation on right-of-use assets. The Board of S4Capital Group uses gross profit rather than revenue to manage the Company due to the fluctuating amounts of third-party costs and/or pass-through expenses, which form part of revenue. The revenue amounted to £686.6 million, 75% from Content, 24% from Data&Digital Media and 1% from Technology Services. In 2020 the revenue amounted to £342.7 million, 78% from Content practice and 22% from Data&Digital Media. No analysis of the assets and liabilities of each operating segment is provided to the chief operating decision maker (‘CODM’) in the monthly management accounts; therefore, no measure of segmental assets or liabilities is disclosed in this Note. C. Revenue by geography An analysis of external revenue by geographical market is given below: 2021 2020 £000 £000 The Americas 452,608 243,458 Europe, Middle East & Africa 166,133 70,611 Asia Pacific 67,860 28,618 Total 686,601 342,687 S4Capital Annual Report and Accounts 2021 133
 s4 capital annual report and accounts 2021 Page 134 Page 136