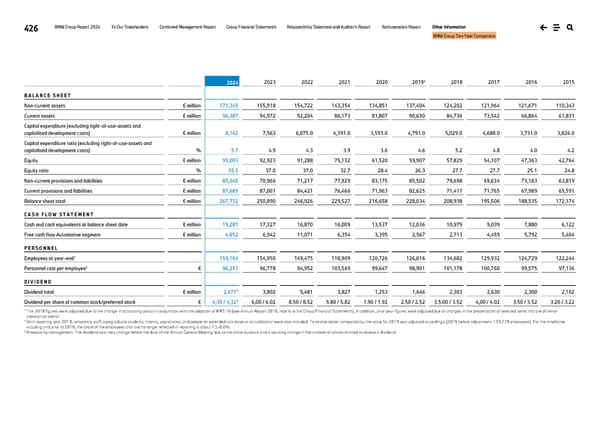
426 BMW Group Report 2024 To Our Stakeholders Combined Management Report Group Financial Statements Responsibility Statement and Auditor’s Report Remuneration Report Other Information BMW Group Ten-Year Comparison 2024 2023 2022 2021 2020 2019¹ 2018 2017 2016 2015 B A L A N C E S H E E T Non-current assets € million 171,345 155,918 154,722 143,354 134,851 137,404 124,202 121,964 121,671 110,343 Current assets € million 96,387 94,972 92,204 86,173 81,807 90,630 84,736 73,542 66,864 61,831 Capital expenditure (excluding right-of-use-assets and capitalised development costs) € million 8,142 7,563 6,075.0 4,391.0 3,593.0 4,791.0 5,029.0 4,688.0 3,731.0 3,826.0 Capital expenditure ratio (excluding right-of-use-assets and capitalised development costs) % 5.7 4.9 4.3 3.9 3.6 4.6 5.2 4.8 4.0 4.2 Equity € million 95,003 92,923 91,288 75,132 61,520 59,907 57,829 54,107 47,363 42,764 Equity ratio % 35.5 37.0 37.0 32.7 28.4 26.3 27.7 27.7 25.1 24.8 Non-current provisions and liabilities € million 85,040 70,966 71,217 77,929 83,175 85,502 79,698 69,634 73,183 63,819 Current provisions and liabilities € million 87,689 87,001 84,421 76,466 71,963 82,625 71,411 71,765 67,989 65,591 Balance sheet total € million 267,732 250,890 246,926 229,527 216,658 228,034 208,938 195,506 188,535 172,174 C A S H F L O W S T A T E M E N T Cash and cash equivalents at balance sheet date € million 19,287 17,327 16,870 16,009 13,537 12,036 10,979 9,039 7,880 6,122 Free cash flow Automotive segment € million 4,852 6,942 11,071 6,354 3,395 2,567 2,713 4,459 5,792 5,404 P E R S O N N E L Employees at year-end2 159,104 154,950 149,475 118,909 120,726 126,016 134,682 129,932 124,729 122,244 Personnel cost per employee2 € 96,251 96,778 94,952 103,569 99,647 98,901 101,178 100,760 99,575 97,136 D I V I D E N D Dividend total € million 2,6773 3,802 5,481 3,827 1,253 1,646 2,303 2,630 2,300 2,102 Dividend per share of common stock/preferred stock € 4,30 / 4,323 6,00 / 6.02 8.50 / 8.52 5.80 / 5.82 1.90 / 1.92 2.50 / 2.52 3.5.00 / 3.52 4,00 / 4.02 3.50 / 3.52 3.20 / 3.22 1 The 2018 figures were adjusted due to the change in accounting policy in conjunction with the adoption of IFRS 16 (see Annual Report 2019, note 6 to the Group Financial Statements). In addition, prior year figures were adjusted due to changes in the presentation of selected items that are of minor importance overall. 2 Until reporting year 2019, temporary staff, postgraduate students, interns, apprentices, and people on extended sick leave or on sabbatical were also included. To enable better comparability, the value for 2019 was adjusted accordingly (2019 before adjustment: 133,778 employees). For the timeframe including and prior to 2018, the share of the employees that are no longer reflected in reporting is about 7.5-8.0%. 3 Proposal by management. The dividend total may change before the date of the Annual General Meeting due to the share buyback and a resulting change in the number of shares entitled to receive a dividend.
 BMW Group Report 2024 Page 425 Page 427