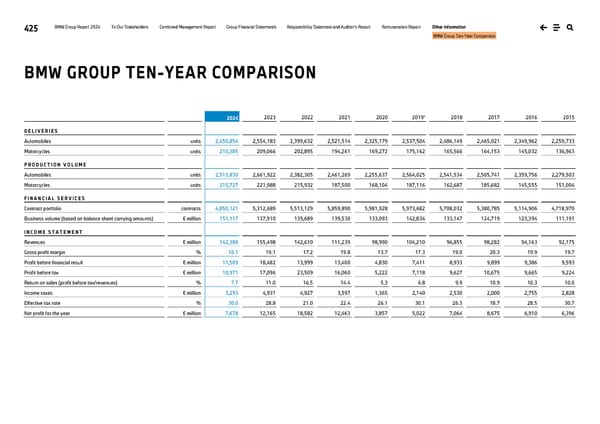
425 BMW Group Report 2024 To Our Stakeholders Combined Management Report Group Financial Statements Responsibility Statement and Auditor’s Report Remuneration Report Other Information BMW Group Ten-Year Comparison 2024 2023 2022 2021 2020 2019¹ 2018 2017 2016 2015 D E L I V E R I E S Automobiles units 2,450,854 2,554,183 2,399,632 2,521,514 2,325,179 2,537,504 2,486,149 2,465,021 2,349,962 2,259,733 Motorcycles units 210,385 209,066 202,895 194,261 169,272 175,162 165,566 164,153 145,032 136,963 P R O D U C T I O N V O L U M E Automobiles units 2,513,830 2,661,922 2,382,305 2,461,269 2,255,637 2,564,025 2,541,534 2,505,741 2,359,756 2,279,503 Motorcycles units 215,727 221,988 215,932 187,500 168,104 187,116 162,687 185,682 145,555 151,004 F I N A N C I A L S E R V I C E S Contract portfolio contracts 4,850,121 5,312,689 5,513,129 5,859,890 5,981,928 5,973,682 5,708,032 5,380,785 5,114,906 4,718,970 Business volume (based on balance sheet carrying amounts) € million 151,117 137,910 135,689 139,530 133,093 142,834 133,147 124,719 123,394 111,191 I N C O M E S T A T E M E N T Revenues € million 142,380 155,498 142,610 111,239 98,990 104,210 96,855 98,282 94,163 92,175 Gross profit margin % 16.1 19.1 17.2 19.8 13.7 17.3 19.0 20.3 19.9 19.7 Profit before financial result € million 11,509 18,482 13,999 13,400 4,830 7,411 8,933 9,899 9,386 9,593 Profit before tax € million 10,971 17,096 23,509 16,060 5,222 7,118 9,627 10,675 9,665 9,224 Return on sales (profit before tax/revenues) % 7.7 11.0 16.5 14.4 5.3 6.8 9.9 10.9 10.3 10.0 Income taxes € million 3,293 4,931 4,927 3,597 1,365 2,140 2,530 2,000 2,755 2,828 Effective tax rate % 30.0 28.8 21.0 22.4 26.1 30.1 26.3 18.7 28.5 30.7 Net profit for the year € million 7,678 12,165 18,582 12,463 3,857 5,022 7,064 8,675 6,910 6,396 BMW GROUP TEN-YEAR COMPARISON
 BMW Group Report 2024 Page 424 Page 426