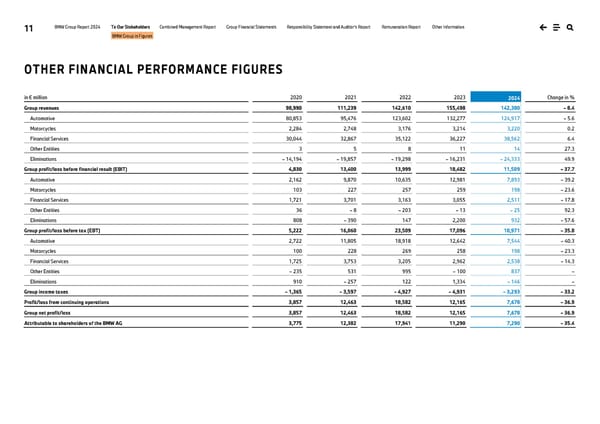
11 BMW Group Report 2024 To Our Stakeholders Combined Management Report Group Financial Statements Responsibility Statement and Auditor’s Report Remuneration Report Other Information BMW Group in Figures OTHER FINANCIAL PERFORMANCE FIGURES in € million 2020 2021 2022 2023 2024 Change in % Group revenues 98,990 111,239 142,610 155,498 142,380 – 8.4 Automotive 80,853 95,476 123,602 132,277 124,917 – 5.6 Motorcycles 2,284 2,748 3,176 3,214 3,220 0.2 Financial Services 30,044 32,867 35,122 36,227 38,562 6.4 Other Entities 3 5 8 11 14 27.3 Eliminations – 14,194 – 19,857 – 19,298 – 16,231 – 24,333 49.9 Group profit/loss before financial result (EBIT) 4,830 13,400 13,999 18,482 11,509 – 37.7 Automotive 2,162 9,870 10,635 12,981 7,893 – 39.2 Motorcycles 103 227 257 259 198 – 23.6 Financial Services 1,721 3,701 3,163 3,055 2,511 – 17.8 Other Entities 36 – 8 – 203 – 13 – 25 92.3 Eliminations 808 – 390 147 2,200 932 – 57.6 Group profit/loss before tax (EBT) 5,222 16,060 23,509 17,096 10,971 – 35.8 Automotive 2,722 11,805 18,918 12,642 7,544 – 40.3 Motorcycles 100 228 269 258 198 – 23.3 Financial Services 1,725 3,753 3,205 2,962 2,538 – 14.3 Other Entities – 235 531 995 – 100 837 – Eliminations 910 – 257 122 1,334 – 146 – Group income taxes – 1,365 – 3,597 – 4,927 – 4,931 – 3,293 – 33.2 Profit/loss from continuing operations 3,857 12,463 18,582 12,165 7,678 – 36.9 Group net profit/loss 3,857 12,463 18,582 12,165 7,678 – 36.9 Attributable to shareholders of the BMW AG 3,775 12,382 17,941 11,290 7,290 – 35.4
 BMW Group Report 2024 Page 10 Page 12