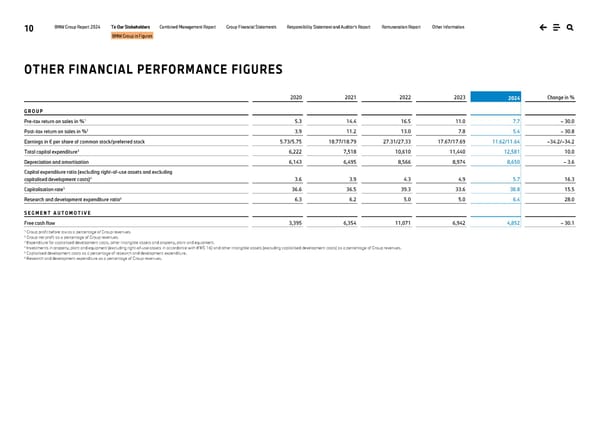
10 BMW Group Report 2024 To Our Stakeholders Combined Management Report Group Financial Statements Responsibility Statement and Auditor’s Report Remuneration Report Other Information BMW Group in Figures OTHER FINANCIAL PERFORMANCE FIGURES 2020 2021 2022 2023 2024 Change in % G R O U P Pre-tax return on sales in %1 5.3 14.4 16.5 11.0 7.7 – 30.0 Post-tax return on sales in %2 3.9 11.2 13.0 7.8 5.4 – 30.8 Earnings in € per share of common stock/preferred stock 5.73/5.75 18.77/18.79 27.31/27.33 17.67/17.69 11.62/11.64 –34.2/–34.2 Total capital expenditure3 6,222 7,518 10,610 11,440 12,581 10.0 Depreciation and amortisation 6,143 6,495 8,566 8,974 8,650 – 3.6 Capital expenditure ratio (excluding right-of-use assets and excluding capitalised development costs)4 3.6 3.9 4.3 4.9 5.7 16.3 Capitalisation rate5 36.6 36.5 39.3 33.6 38.8 15.5 Research and development expenditure ratio6 6.3 6.2 5.0 5.0 6.4 28.0 S E G M E N T A U T O M O T I V E Free cash flow 3,395 6,354 11,071 6,942 4,852 – 30.1 1 Group profit before tax as a percentage of Group revenues. 2 Group net profit as a percentage of Group revenues. 3 Expenditure for capitalised development costs, other intangible assets and property, plant and equipment. 4 Investments in property, plant and equipment (excluding right-of-use assets in accordance with IFRS 16) and other intangible assets (excluding capitalised development costs) as a percentage of Group revenues. 5 Capitalised development costs as a percentage of research and development expenditure. 6 Research and development expenditure as a percentage of Group revenues.
 BMW Group Report 2024 Page 9 Page 11