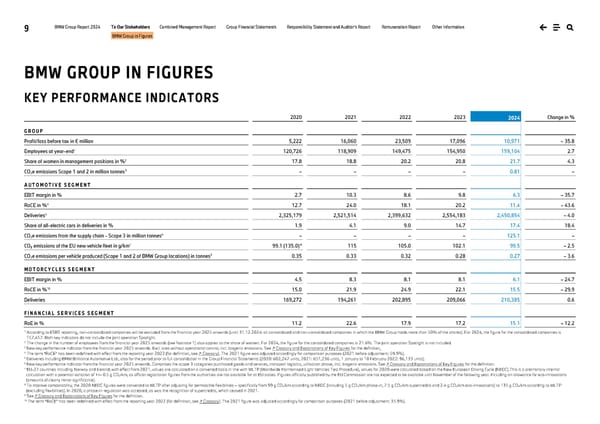
9 BMW Group Report 2024 To Our Stakeholders Combined Management Report Group Financial Statements Responsibility Statement and Auditor’s Report Remuneration Report Other Information BMW Group in Figures KEY PERFORMANCE INDICATORS 2020 2021 2022 2023 2024 Change in % G R O U P Profit/loss before tax in € million 5,222 16,060 23,509 17,096 10,971 – 35.8 Employees at year-end1 120,726 118,909 149,475 154,950 159,104 2.7 Share of women in management positions in %2 17.8 18.8 20.2 20.8 21.7 4.3 CO2e emissions Scope 1 and 2 in million tonnes3 – – – – 0.81 – A U T O M O T I V E S E G M E N T EBIT margin in % 2.7 10.3 8.6 9.8 6.3 – 35.7 RoCE in %4 12.7 24.0 18.1 20.2 11.4 – 43.6 Deliveries5 2,325,179 2,521,514 2,399,632 2,554,183 2,450,854 – 4.0 Share of all-electric cars in deliveries in % 1.9 4.1 9.0 14.7 17.4 18.4 CO2e emissions from the supply chain - Scope 3 in million tonnes6 – – – – 125.1 – CO₂ emissions of the EU new vehicle fleet in g/km7 99.1 (135.0) 8 115 105.0 102.1 99.5 – 2.5 CO2e emissions per vehicle produced (Scope 1 and 2 of BMW Group locations) in tonnes9 0.35 0.33 0.32 0.28 0.27 – 3.6 M O T O R C Y C L E S S E G M E N T EBIT margin in % 4.5 8.3 8.1 8.1 6.1 – 24.7 RoCE in %10 15.0 21.9 24.9 22.1 15.5 – 29.9 Deliveries 169,272 194,261 202,895 209,066 210,385 0.6 F I N A N C I A L S E R V I C E S S E G M E N T RoE in % 11.2 22.6 17.9 17.2 15.1 – 12.2 1 According to ESRS reporting, non-consolidated companies will be excluded from the financial year 2025 onwards (until 31.12.2024: all consolidated and non-consolidated companies in which the BMW Group holds more than 50% of the shares). For 2024, the figure for the consolidated companies is 157,457. Both key indicators do not include the joint operation Spotlight. 2 The change in the number of employees from the financial year 2025 onwards (see footnote 1) also applies to the share of women. For 2024, the figure for the consolidated companies is 21.6%. The joint operation Spotlight is not included. 3 New key performance indicator from the financial year 2025 onwards. Excl. sites without operational control, incl. biogenic emissions. See ↗ Glossary and Explanations of Key Figures for the definition. 4 The term “RoCE” has been redefined with effect from the reporting year 2022 (for definition, see ↗ Glossary). The 2021 figure was adjusted accordingly for comparison purposes (2021 before adjustment: 59.9%). 5 Deliveries including BMW Brilliance Automotive Ltd., also for the period prior to full consolidation in the Group Financial Statements (2020: 602,247 units, 2021: 651,236 units, 1 January to 10 February 2022: 96,133 units). 6 New key performance indicator from the financial year 2025 onwards. Comprises the scope 3 categories purchased goods and services, transport logistics, utilisation phase, incl. biogenic emissions. See ↗ Glossary and Explanations of Key Figures for the definition. 7 EU-27 countries including Norway and Iceland; with effect from 2021, values are calculated on a converted basis in line with WLTP (Worldwide Harmonised Light Vehicles Test Procedure), values for 2020 were calculated based on the New European Driving Cycle (NEDC).This is a preliminary internal calculation with a potential variation of +/– 0.5 g CO2/km, as official registration figures from the authorities are not available for all EU states. Figures officially published by the EU Commission are not expected to be available until November of the following year. Including an allowance for eco-innovations (amounts of clearly minor significance). 8 To improve comparability, the 2020 NEDC figures were converted to WLTP after adjusting for permissible flexibilities – specifically from 99 g CO2/km according to NEDC (including 5 g CO2/km phase-in, 7.5 g CO2/km supercredits and 2.4 g CO2/km eco-innovations) to 135 g CO2/km according to WLTP (excluding flexibilities). In 2020, a phase-in regulation was accepted, as was the recognition of supercredits, which ceased in 2021. 9 See ↗ Glossary and Explanations of Key Figures for the definition. 10 The term “RoCE” has been redefined with effect from the reporting year 2022 (for definition, see ↗ Glossary). The 2021 figure was adjusted accordingly for comparison purposes (2021 before adjustment: 35.9%). BMW GROUP IN FIGURES
 BMW Group Report 2024 Page 8 Page 10