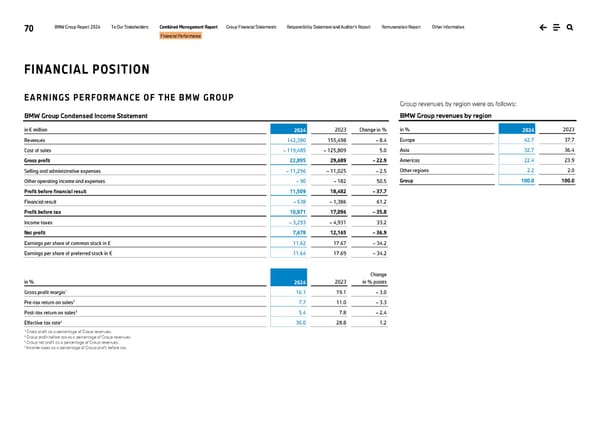
70 BMW Group Report 2024 To Our Stakeholders Combined Management Report Group Financial Statements Responsibility Statement and Auditor’s Report Remuneration Report Other Information Financial Performance FINANCIAL POSITION EARNINGS PERFORMANCE OF THE BMW GROUP BMW Group Condensed Income Statement in € million 2024 2023 Change in % Revenues 142,380 155,498 – 8.4 Cost of sales – 119,485 – 125,809 5.0 Gross profit 22,895 29,689 – 22.9 Selling and administrative expenses – 11,296 – 11,025 – 2.5 Other operating income and expenses – 90 – 182 50.5 Profit before financial result 11,509 18,482 – 37.7 Financial result – 538 – 1,386 61.2 Profit before tax 10,971 17,096 – 35.8 Income taxes – 3,293 – 4,931 33.2 Net profit 7,678 12,165 – 36.9 Earnings per share of common stock in € 11.62 17.67 – 34.2 Earnings per share of preferred stock in € 11.64 17.69 – 34.2 in % 2024 2023 Change in % points Gross profit margin1 16.1 19.1 – 3.0 Pre-tax return on sales2 7.7 11.0 – 3.3 Post-tax return on sales3 5.4 7.8 – 2.4 Effective tax rate4 30.0 28.8 1.2 1 Gross profit as a percentage of Group revenues. 2 Group profit before tax as a percentage of Group revenues. 3 Group net profit as a percentage of Group revenues. 4 Income taxes as a percentage of Group profit before tax. Group revenues by region were as follows: BMW Group revenues by region in % 2024 2023 Europe 42.7 37.7 Asia 32.7 36.4 Americas 22.4 23.9 Other regions 2.2 2.0 Group 100.0 100.0
 BMW Group Report 2024 Page 69 Page 71