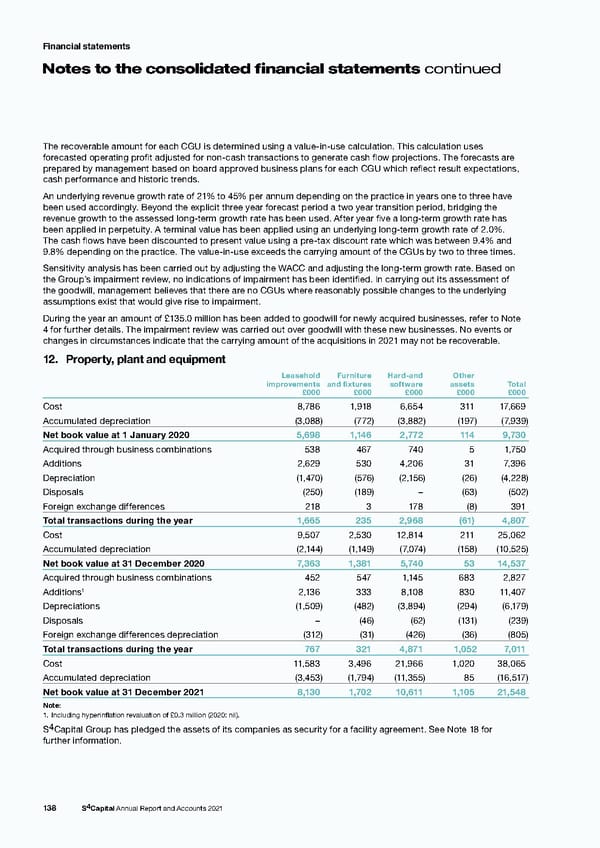
Financial statements N otes to the consolidated financial statements continued The recoverable amount for each CGU is determined using a value-in-use calculation. This calculation uses forecasted operating profit adjusted for non-cash transactions to generate cash flow projections. The forecasts are prepared by management based on board approved business plans for each CGU which reflect result expectations, cash performance and historic trends. An underlying revenue growth rate of 21% to 45% per annum depending on the practice in years one to three have been used accordingly. Beyond the explicit three year forecast period a two year transition period, bridging the revenue growth to the assessed long-term growth rate has been used. After year five a long-term growth rate has been applied in perpetuity. A terminal value has been applied using an underlying long-term growth rate of 2.0%. The cash flows have been discounted to present value using a pre-tax discount rate which was between 9.4% and 9.8% depending on the practice. The value-in-use exceeds the carrying amount of the CGUs by two to three times. Sensitivity analysis has been carried out by adjusting the WACC and adjusting the long-term growth rate. Based on the Group’s impairment review, no indications of impairment has been identified. In carrying out its assessment of the goodwill, management believes that there are no CGUs where reasonably possible changes to the underlying assumptions exist that would give rise to impairment. During the year an amount of £135.0 million has been added to goodwill for newly acquired businesses, refer to Note 4 for further details. The impairment review was carried out over goodwill with these new businesses. No events or changes in circumstances indicate that the carrying amount of the acquisitions in 2021 may not be recoverable. 12. Property, plant and equipment Leasehold Furniture Hard-and Other improvements and fixtures software assets Total £000 £000 £000 £000 £000 Cost 8,786 1,918 6,654 311 17,669 Accumulated depreciation (3,088) (772) (3,882) (197) ( 7,939) Net book value at 1 January 2020 5,698 1,146 2,772 114 9,730 Acquired through business combinations 538 467 740 5 1,750 Additions 2,629 530 4,206 31 7,396 Depreciation (1,470) (576) ( 2,156) (26) (4,228) Disposals (250) (189) – (63) (502) Foreign exchange differences 218 3 178 (8) 391 Total transactions during the year 1,665 235 2,968 (61) 4,807 Cost 9,507 2,530 12,814 211 25,062 Accumulated depreciation ( 2,144) (1,149) ( 7,074) (158) (10,525) Net book value at 31 December 2020 7,363 1,381 5,740 53 14,537 Acquired through business combinations 452 547 1,145 683 2,827 1 2,136 333 8,108 830 11,407 Additions Depreciations (1,509) (482) (3,894) (294) ( 6,179) Disposals – (46) (62) (131) (239) Foreign exchange differences depreciation (312) (31) (426) (36) (805) Total transactions during the year 767 321 4,871 1,052 7,011 Cost 11,583 3,496 21,966 1,020 38,065 Accumulated depreciation (3,453) (1,794) (11,355) 85 (16,517) Net book value at 31 December 2021 8,130 1,702 10,611 1,105 21,548 Note: 1. Including hyperinflation revaluation of £0.3 million (2020: nil). S4Capital Group has pledged the assets of its companies as security for a facility agreement. See Note 18 for further information. 138 S4Capital Annual Report and Accounts 2021
 s4 capital annual report and accounts 2021 Page 139 Page 141