Meet Fresh Cow Manager (Open)
Discover the user-friendly Fresh Cow Manager, a technology designed to improve cow health and boost milk production efficiently.
Technology so easy... Even a Cow can use it! Drive cow health & milk production with Fresh Cow Manager
Introducing FCM The Story The Problem Alternatives & Collaborations The Solution Summary Results Is the Impact Significant? The Environmental Impact The Business Opportunity Whats Next...? AI, AI, AI


RT Barcik CEO, Fresh Cow Manager Fresh Cow Manager Story For many farms, barn space is limited. Cows with costly health treatments, that missed milk production minimums, or arent already pregnant soon make room for their replacements. Many of these voluntary culling decisions are easy to make. By naturally solving these health, production, and reproduction challenges we make these culling decisions more difficult... which is a good thing... 15+ years of collaboration between professionals in the Large Animal Veterinary, Dairy, Behavioural Sciences, and High Technology industries has resulted in a patented new technology designed to improve producer margins simply by changing cow behaviour. Were excited to share how novel stimulation drives measurable improvements on overall animal health, production, and reproduction. These improvements not only impact animal and farm health and longevity, but the environment as well.
In Dairy parlance a Fresh Cow is one that just had a calf The Fresh Cow Problem
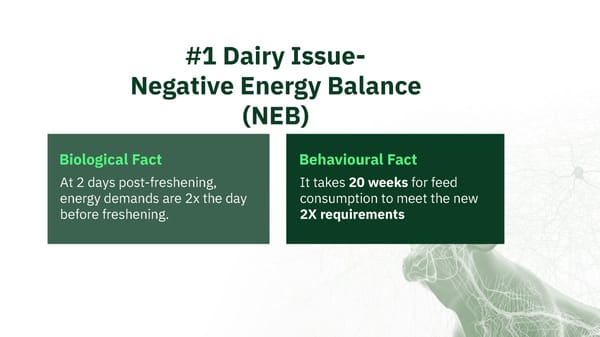
#1 Dairy Issue At 2 days post-freshening, energy demands are 2x the day before freshening. Biological Fact It takes 20 weeks for feed consumption to meet the new 2X requirements Behavioural Fact Negative Energy Balance
Negative Energy Balance Basics 100% of fresh cows have reduced digestive capacity 30-35% digestive capacity reduction 100% of fresh cows have suppressed immune systems > 50% of fresh cows have at least 1 additional health issue, further taxing the immune system BOTTOM LINE... Fresh cow energy demands far outpace consumption. Resulting in Negative Energy Balance for ALL Fresh Cows.
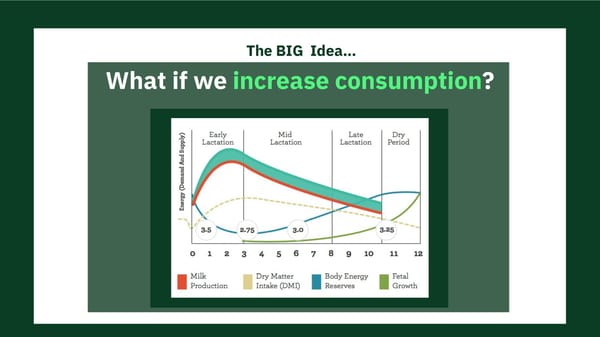
Negative Energy Balance Over a Lactation Cycle Dry Matter Intake (DMI) doesnt catch up to demand until 140 Days In Milk (DIM) , resulting in a NEGATIVE ENERGY BALANCE (NEB) over that period. NEB causes its own problems which further drains the Immune System.
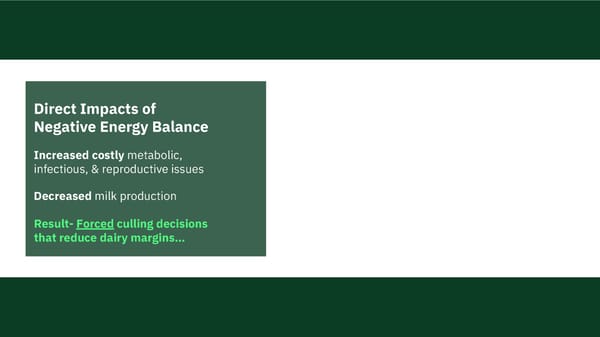
Decreased milk production Impacts of Negative Energy Balance Increased costly metabolic, infectious, & reproductive issues Result- Forced culling decisions that reduce dairy margins...
The BIG Idea... What if we increase consumption?
The Solution
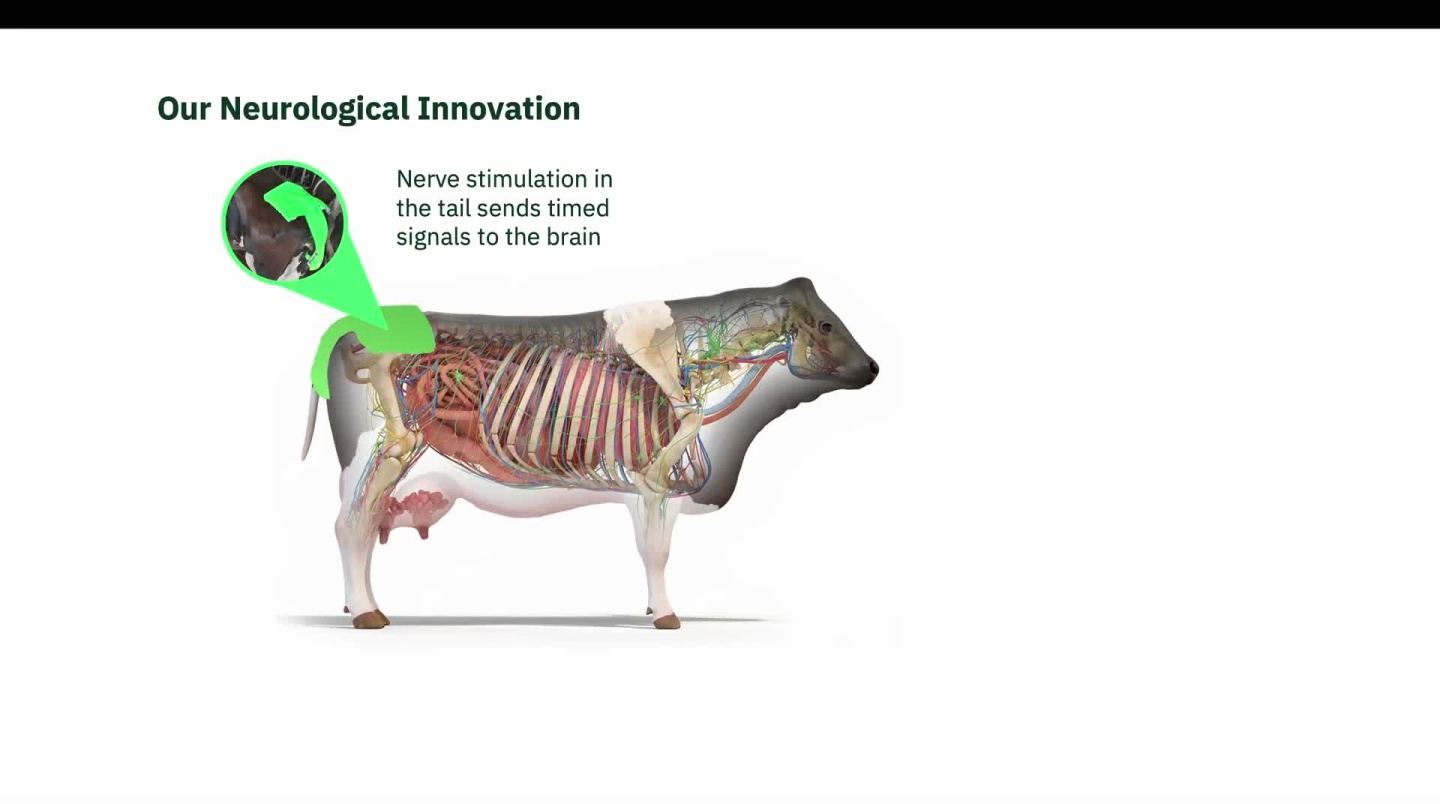
A wearable technology that helps naturally solve cow health, production, and reproduction problems simply by getting them to eat more! Meet the Fresh Cow Manager

How FCM works
This is a modal window.

This is a modal window.
Easy Fresh Cow Manager Installation

Summary Results
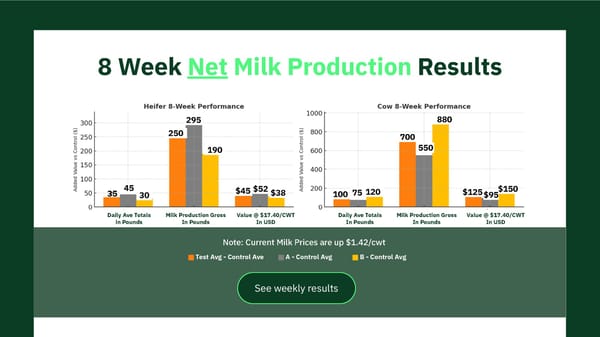
8 Week Net Milk Production Results Daily Ave Totals Milk production gross Value @ $17.40/CWT Daily Ave Totals Milk production gross Value @ $17.40/CWT Test Avg - Control Ave A - Control Avg B - Control Avg Note: Current Milk Prices are up $1.42/cwt 35 45 30 250 295 190 $45 $52 $38 100 120 75 700 550 880 $125 $150 $95 See weekly results
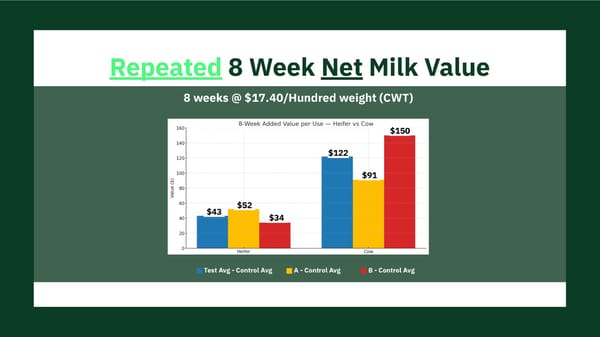
Repeated 8 Week Net Milk Value 8 weeks @ $17.40/Hundred weight (CWT) Test Avg - Control Avg A - Control Avg B - Control Avg $43 $52 $34 $122 $91 $150
Is The Impact Significant?
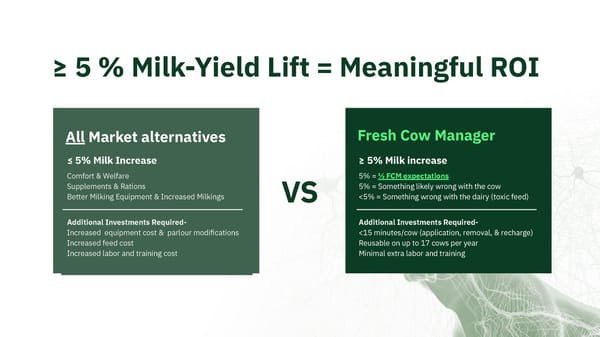
5 % Milk-Yield Lift = Meaningful ROI Fresh Cow Manager 5% = FCM expectations 5% = Something likely wrong with the cow <5% = Something wrong with the dairy (toxic feed) 5% Milk increase 10 minutes labor per cow per year Reusable on 17+ cows Minimal extra labor All Market alternatives Comfort & Welfare Supplements & Rations Better Milking Equipment & Increased Milkings 5% Milk Increase Increased equipment cost & parlour modifications Increased feed cost Increased labor and training cost VS
Example farm analysis * Public sources, FCM data, industry research & estimates Scale 8500 milking cows on 4 farms Avg farm 2125 head FCM Cost Device = $350 + variable Uses / yr = 17.3 Annual cost = $518 KS economics IOFC = $8.6 CWT Cow replacement cost = $1680 Real Estate Cost for farm only = $4M Labour Average employee salary = $25K
Potential Milk Yield Increase of 16+% Significant 5% Expected 10% Potential 16+%
Annual Farm Equivalents of Using FCM FCM Performance Farm hands Replacement cows New farm 16% increase 5 340 .16 10% increase 4 213 .10 5% increase 2 106 .05 At these rates, using FCM on ALL cows would produce the Equivalent Annual Milk Value of adding these other investments to McCarthy Farm. Values for Improved Health, Reproductive, and Culling Revenue Not Included.
Market Alternatives & Potential Collaborations
Top 10 Dairy Technologies- Partner M&A targets 9.2M dairy cows & 95M beef cows in US alone Low startup risk - SG&A, R&D nearly paid for 1. Automated Milking Systems (AMS) 2. Activity Monitors (e.g., SCR, CowManager) 3. Rumen Boluses (e.g., smaXtec) 4. Milk Analyzers (e.g., Afimilk) 5. Herd Management Software (e.g., DairyComp, VAS) 6. Feed Automation & Mixers (e.g., Lely Vector) 7. Genomic Selection Tools 8. Robotic Feed Pushers (e.g., Juno) 9. Thermal Imaging Cameras for Mastitis Detection 10. Wearable Sensors for Heat & Health Detection Introductory gross margin on 500 units = $194 / 63.6% Margin improves with
Top 10 Solutions Targeting NEB 9.2M dairy cows & 95M beef cows in US alone Low startup risk - SG&A, R&D nearly paid for Introductory gross margin on 500 units = $194 / 63.6% Margin improves with Solution Type Examples / Brands Weaknesses Propylene Glycol Drench Ketostix, Keto-Check Labor intensive, stress Monensin (Rumensin) Feed additive Regulatory scrutiny Niacin or Choline Feed additives Variable uptake DCAD Diets (Anionic salts) Pre-fresh cows Only preventive Rumen-protected nutrients Amino acids, fats Costly, long-term Calcium Boluses Bovikalc, CalBoost Single nutrient Activity Trackers CowManager, Heatime Passive, not interventional In-rumen Devices smaXtec, BolusMed High initial cost Cattle Chutes w/Weighing Manual monitoring Labor heavy Post-calving Protocols Blanket treatments Non-targeted, expensive
Basics of How FCM Compares 9.2M dairy cows & 95M beef cows in US alone Low startup risk - SG&A, R&D nearly paid for Introductory gross margin on 500 units = $194 / 63.6% Margin improves with Key Differentiator : FCM drives behavioral intervention its not (yet) a monitor, like most tech, it actively triggers a biologically beneficial response : movement feed intake immune recovery & optimization lowered health cost increased milk yield reproductive readiness. Feature Fresh Cow Manager Other Technologies Targeted Intervention Tail-nerve-based activation Monitoring-only Immediate Activity Impact Rapid behavior change Passive or delayed Labor Efficiency Quick stimulation, no meds Drenching, feeding labor Drug-Free Natural activation Additives, antibiotics ROI Potential Health + yield boost Mixed clinical outcomes CapEx Friendly Simple device Boluses, sensors costly
Competitive Comparison 9.2M dairy cows & 95M beef cows in US alone Low startup risk - SG&A, R&D nearly paid for Introductory gross margin on 500 units = $194 / 63.6% Margin improves with Feature / Metric Fresh Cow Manager Typical NEB Solutions Type of Intervention Behavioral stimulation Nutritional / Pharmaceutical Milk Production Increase (Avg) 10+% (16-18% frequent) 3-7% (wild variations) Time to Apply <15 minutes 1560 minutes Reusability 17 cows/year per unit Single-use or short-term Per-Cow Cost ~$27.50/use (sale price basis) $3070/treatment (avg) Side Effects / Risks None Possible metabolic side effects Regulatory Risk None (non-pharmaceutical) Medium to high (drugs, additives) Gross Margin (%) ~54% blended 74% Core Tech Varies; typically lower Payback Period 1-2 3 week uses (< year) Often >1 lactation cycle Innovation Level High (patented, interventional) Low to moderate
The Environmental Impact
10 bn Population by year 2050 4.5 bn Middle class by year 2050 70% Food demand by year 2050 To meet future food demands, global production will need to increase by 70%. Applying technology will be a key.
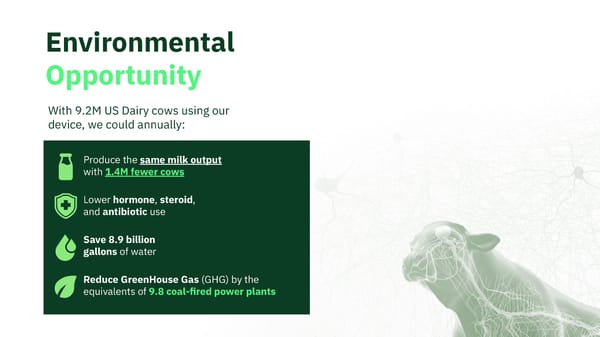
Environmental Opportunity With 9.2M US Dairy cows using our device, we could annually: Produce the same milk output with 1.4M fewer cows Lower hormone , steroid , and antibiotic use Save 8.9 billion gallons of water Reduce GreenHouse Gas (GHG) by the equivalents of 9.8 coal-fired power plants

This is a modal window.
Environmental Opportunity Calculations
The Business Opportunity
Bringing value to dairy farmers 387 more gallons/cow/year $350+ annual income over feed cost cow/year National opportunity of $3.2B to dairymen Global opportunity $91B to dairyman
Annual Gross Margin Calculations 9.2M dairy cows & 95M beef cows in US alone Low startup risk - SG&A, R&D nearly paid for Introductory gross margin on 500 units = $194 / 63.6% Margin improves with Device Economics Sales Price Manufacture Cost Unit Margin Annual Uses Revenue per use Annualized Cost Annualized Revenue Per Unit Annualized Gross Margin Reusable- Annual Controller & Stimulator $350.00 $92.00 $258.00 17 $20.59 $92.00 $350.00 74% Charger $60.00 $20.00 $40.00 365 $0.16 $20.00 $60.00 67% Subtotal $410.00 $112.00 $298.00 382 $20.75 $112.00 $410.00 73% Single Use Sleeve $9.00 $4.75 $4.25 1 $9.00 $80.75 $153.00 47% Strap $1.00 $1.00 $0.00 1 $1.00 $17.00 $17.00 0% Agricultural Adhesive $5.00 $5.00 $0.00 1 $5.00 $85.00 $85.00 0% Subtotal $15.00 $10.75 $4.25 3 $15.00 $182.75 $255.00 28% Blended Totals $425.00 $122.75 $302.25 385 $35.75 $294.75 $665.00 56%
Annual Numbers Per 1000 Cows 9.2M dairy cows & 95M beef cows in US alone Low startup risk - SG&A, R&D nearly paid for Introductory gross margin on 500 units = $194 / 63.6% Margin improves with Device Economics per 1000 Cows Annual Unit Needs per 1000 Cows Annual Sales Revenue per 1000 cows Annual COGS of 1000 Cows Annual Profit Margin Annualized Gross Margin Per 1000 cows Reusable- Annual Controller & Stimulator 70 $24,500.00 $6,440.00 $18,060.00 74% Charger 1 $60.00 $20.00 $40.00 67% Subtotal $24,560.00 $6,460.00 $18,100.00 74% Single Use Sleeve 1000 $9,000.00 $4,750.00 $4,250.00 47% Strap 1000 $1,000.00 $1,000.00 $0.00 0% Agricultural Adhesive 1000 $5,000.00 $5,000.00 $0.00 0% Subtotal $15,000.00 $10,750.00 $4,250.00 28% Blended Totals $39,560.00 $17,210.00 $22,350.00 56%
Annual US & EU Dairy Farmer ROI at Expected 10% for 1000 Cows 9.2M dairy cows & 95M beef cows in US alone Low startup risk - SG&A, R&D nearly paid for Introductory gross margin on 500 units = $194 / 63.6% Margin improves with US- Per FCM EU-Per FCM US- 1000 Cows EU- 1000 Cows Average Annual Lactation 24000 18500 24000000 18500000 10% increase 2400 1850 2400000 1850000 Hundred Weights 24 18.5 24000 18500 Hundred Weight Prices $18.82 $26 $18.82 $26 Per Use Milk Value $452 $481 $451,680 $481,000 Value of 17 Uses Per Year $7,679 $8,177 $451,680 $481,000 Annualized FCM Cost $665 $665 $39,560 $39,560 Dairy Farmer ROI in Dollars $7,014 $7,512 $412,120 $441,440 Dairy Farmer ROI Multiple 10.5 11.3 10.4 11.2
Annual US & EU Dairy Farmer ROI at Potential 16% for 1000 Cows 9.2M dairy cows & 95M beef cows in US alone Low startup risk - SG&A, R&D nearly paid for Increased volume of future orders lowers unit cost ROI with 1 st 3 week use means price will increase Next Generation will widen product suite while improving unit margin US- Per FCM EU-Per FCM US- 1000 Cows EU- 1000 Cows Average Annual Lactation 24000 18500 24000000 18500000 16% increase 3840 2960 3840000 2960000 Hundred Weights 38.4 29.6 38400 29600 Hundred Weight Prices $18.82 $26.00 $18.82 $26.00 Per Use Milk Value $722.69 $769.60 $722,688.00 $769,600.00 Value of 17 Uses Per Year $12,285.70 $13,083.20 $722,688.00 $769,600.00 Annualized FCM Cost $665.00 $665.00 $39,560.00 $39,560.00 Dairy Farmer ROI in Dollars $11,620.70 $12,418.20 $683,128.00 $730,040.00 Dairy Farmer ROI Multiple 17.5 18.7 17.3 18.5
<.25% ANNUAL US & EU TAM Penetration @ $100M in Revenue Annual Total Available Market in Millions By Use US EU Total Annual TAM Penetration @ $100M Revenue US EU Total Dairy Freshenings 9 19 28.0 Dairy Freshenings 1.67% 0.79% 0.54% Beef Feedlot 25 12 37.0 Beef Feedlot 0.60% 1.25% 0.41% Combined Annual TAM by use in Millions 65.0 Combined Annual TAM Penetration by use 0.23%
Whats Next...? AI, AI, AI